PM2.5
Annual mean < 5 µg/m³
The World Health Organization sets global standards to protect the public health from air pollution.
Annual mean < 5 µg/m³
Annual mean < 15 µg/m³
8-hour mean < 100 µg/m³
Annual mean < 10 µg/m³
24-hour mean < 40 µg/m³
8-hour mean < 10,000 µg/m³
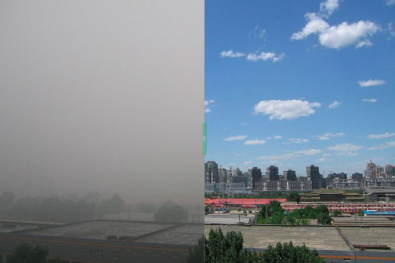
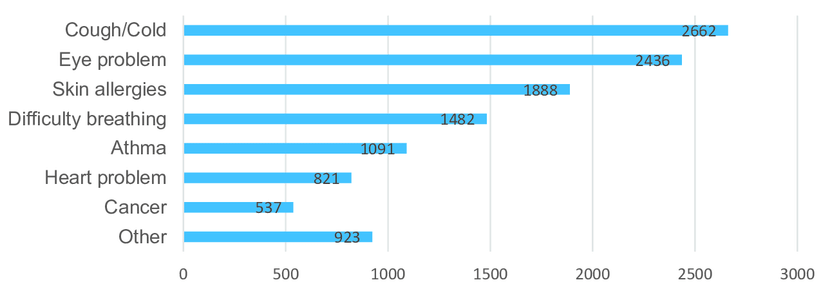
Exceeding these limits increases risks of lung disease, heart problems, and contributes to climate change. Clean air saves lives and improves wellbeing.
Monitor your local Air Quality Index (AQI) using reliable apps or websites to stay informed about daily pollution levels.
Use certified masks to reduce exposure to harmful airborne particles.
Trees help improve air quality and reduce CO₂ in the atmosphere.
Reducing the use of private cars lowers pollution and promotes cleaner air for all.